
A comprehensive analysis of transloading economics for import businesses
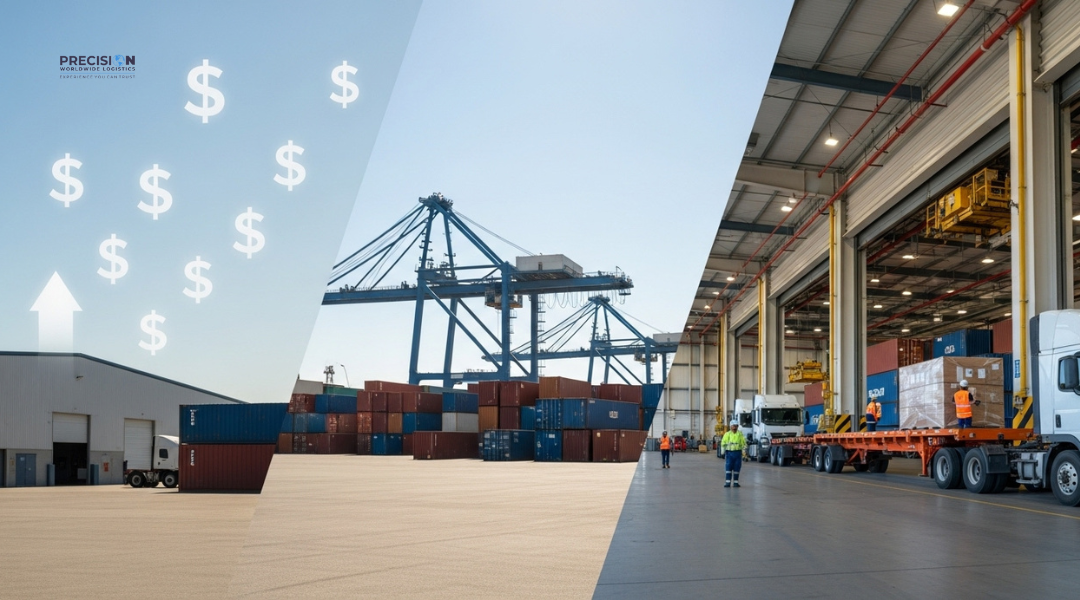
Most importers focus on obvious costs—freight rates, customs duties, insurance premiums. But the port-to-warehouse journey often represents one of the largest hidden cost centers in your supply chain, consuming 15-30% of total logistics spend through inefficiencies you may not even realize exist.
This guide breaks down the true economics of transloading versus traditional warehousing, revealing how a strategic shift can deliver 20-40% cost reductions while simultaneously improving delivery speed.
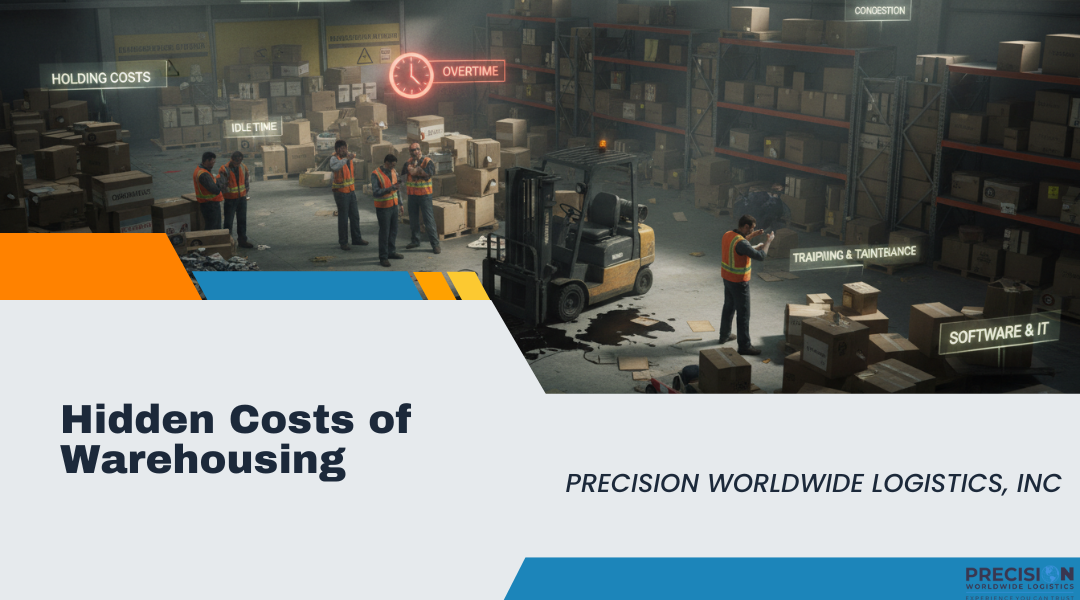
Understanding the Traditional Model’s Hidden Costs
The Conventional Approach
Most importers follow this familiar pattern:
- Container arrives at Port of LA/Long Beach
- Long-haul drayage moves container 50-200+ miles to inland warehouse
- Container sits at warehouse for days/weeks waiting to be unloaded
- Goods are stored in warehouse inventory
- Orders are picked and shipped to final destinations as needed
This seems straightforward—until you calculate the actual costs.
Hidden Cost #1: Long-Haul Drayage Premium
Traditional approach: $800-1,500+ per container to move from port to distant warehouse
Near-port transloading: $200-400 per container for short drayage to transload facility
Immediate savings: $400-1,100 per container on drayage alone
Annual impact at 100 containers/month: $480,000 – $1,320,000 saved
Hidden Cost #2: Per Diem and Demurrage
The silent profit killer: Every day your container sits, costs accumulate.
Typical per diem structure:
- Days 1-5: Free time (included with freight)
- Days 6-10: $75-100 per day
- Days 11-15: $150-200 per day
- Day 16+: $250-300+ per day
Traditional warehouse scenario: Container often sits 7-10 days before unloading (after deducting free time), incurring $150-1,500 in per diem charges per container.
Transloading scenario: Container unloaded within 24-48 hours, returned within free time = $0 per diem
Annual savings at 100 containers/month: $180,000 – $1,800,000
Hidden Cost #3: Warehouse Storage Fees
Traditional warehousing costs:
- Storage: $8-15 per pallet per month
- Receiving: $25-50 per pallet
- Picking/packing: $3-8 per unit
- Administrative fees: 5-8% of warehouse charges
Transloading approach: Minimal storage (1-2 days), flow-through pricing structure
Example calculation:
- Container with 20 pallets
- Stored average 30 days before complete turnover
- Traditional cost: (20 pallets × $12/month × 1 month) + (20 × $35 receiving) = $940
- Transloading cost: $150-250 handling fee
- Savings per container: $690-790
Annual impact at 100 containers/month: $828,000 – $948,000
Hidden Cost #4: Slow Inventory Turns
The opportunity cost everyone underestimates.
Capital tied up in slow-moving inventory carries real costs:
- Cost of capital (6-12% annually for most businesses)
- Obsolescence risk (especially for technology, fashion, seasonal goods)
- Storage space consumption
- Increased handling and loss potential
Traditional approach: Products sit in warehouse 30-90 days on average
Transloading approach: Products in motion, reaching customers in 3-7 days
Value of faster turns: For a business with $10M in annual inventory:
- Traditional: 4 turns per year = $10M average inventory
- Transloading: 12+ turns per year = $3.3M average inventory
- Capital freed up: $6.7M
- Cost of capital saved (at 8%): $536,000 annually
Hidden Cost #5: Inefficient Transportation
Traditional model problems:
- Partial truckloads shipped because warehouse has mixed inventory
- Multiple shipments to same destination because products arrived in different containers weeks apart
- Long-haul trucking from distant warehouse locations
Transloading optimization:
- Consolidate freight at the port before distribution
- Combine multiple containers destined for same region
- Shorter average shipping distances
Typical savings: 20-35% on outbound transportation costs
Example: $500,000 annual outbound shipping × 25% savings = $125,000 annually
Hidden Cost #6: Time-to-Market Delays
Speed has value, especially in competitive markets.
Traditional warehouse timeline:
- Day 1: Container arrives at port
- Days 2-3: Long-haul to warehouse
- Days 4-7: Container waits to be unloaded
- Day 8: Unloaded into warehouse
- Days 9-30: Stored until ordered
- Days 31-35: Picked, packed, shipped to customer
- Total: 35+ days from port arrival to customer delivery
Transloading timeline:
- Day 1: Container arrives, picked up, delivered to transload facility
- Day 2: Unloaded, sorted, loaded onto outbound trucks
- Days 3-5: Direct delivery to customers
- Total: 5 days from port arrival to customer delivery
Value of 30-day acceleration:
- Faster payment collection (improved cash flow)
- Reduced risk of stockouts
- Ability to respond to market trends
- Competitive advantage in fast-moving categories
- Reduced markdown risk for seasonal/fashion goods
Quantified impact: For a seasonal product with 15% markdowns on late arrivals, getting products to market 30 days faster can save $150,000+ annually on a $1M product line.
Real-World ROI Case Studies
Case Study 1: Apparel Retailer
Profile: National clothing brand importing 150 containers monthly from Asia
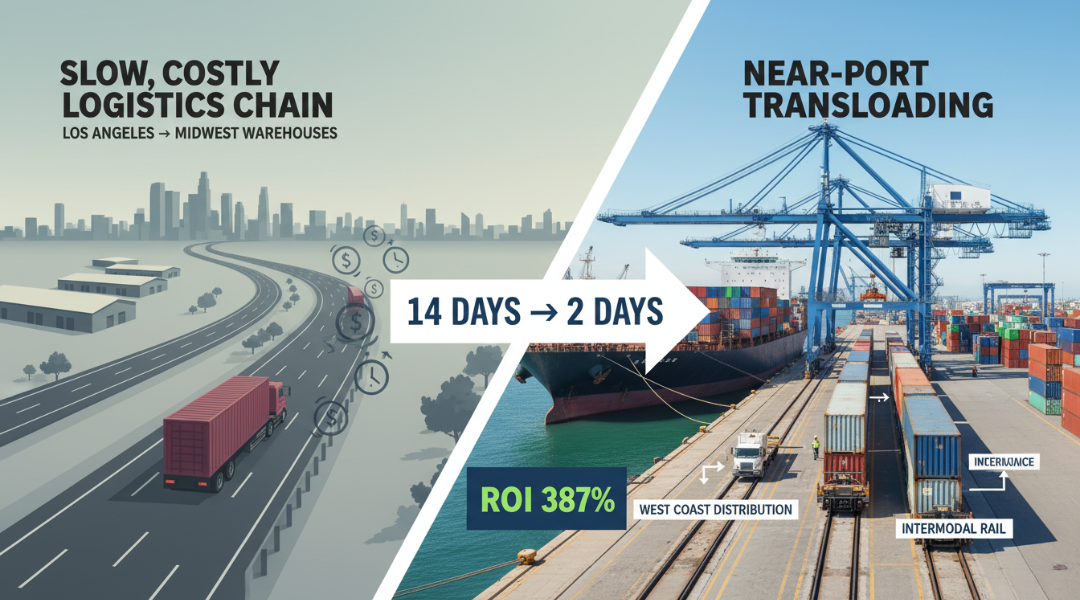
Previous approach:
- Long-haul to Midwest distribution center (1,200 miles from LA)
- Average 14-day cycle from port to DC unload
- Heavy per diem charges
- Products aged before reaching stores
Transloading solution:
- Near-port facility for West Coast distribution (75% of volume)
- Remaining 25% consolidated for intermodal rail to Midwest
- 48-hour turnaround from port to outbound trucks
Results:
- Drayage savings: $1,050/container × 112 containers/month × 12 = $1,411,200/year
- Eliminated per diem: $450/container average × 150/month × 12 = $810,000/year
- Faster turns: Reduced markdowns by 12% = $1,800,000/year
- Total annual savings: $4,021,200
- ROI: 387% in year one
Case Study 2: Electronics Distributor
Profile: Consumer electronics importer, 80 containers monthly, serving West Coast retailers
Previous approach:
- Warehouse 90 miles from port
- Hold inventory for 45-60 days average
- Ship partial truckloads as orders received
Transloading solution:
- Near-port transload with next-day distribution
- Consolidate shipments by retailer before leaving transload facility
- Just-in-time delivery to retailer DCs
Results:
- Drayage savings: $600/container × 80/month × 12 = $576,000/year
- Eliminated storage: $850/container × 80/month × 12 = $816,000/year
- Transportation optimization: 28% reduction in outbound shipping = $425,000/year
- Inventory carrying cost reduction: $680,000/year
- Total annual savings: $2,497,000
- ROI: 312% in year one
Case Study 3: Furniture Importer
Profile: Home goods business, 60 containers monthly, multiple suppliers in Asia
Challenge: Small orders from many suppliers meant frequent partial containers and high per-unit costs
Transloading solution:
- Consolidate multiple supplier containers at transload facility
- Create full truckloads by destination region
- Reduce number of shipments by 40%
Results:
- Consolidation savings: $1,200/shipment × 200 eliminated shipments = $240,000/year
- Reduced per diem (faster processing): $320,000/year
- Warehouse cost elimination: $480,000/year
- Improved inventory turns (faster distribution): $290,000/year
- Total annual savings: $1,330,000
- ROI: 278% in year one
The Transloading Cost-Benefit Model
Typical Cost Structure
Near-Port Transloading Costs:
- Short drayage from terminal: $250-400/container
- Transload handling: $150-300/container
- Brief storage (if needed): $50-100/container
- Outbound transportation: Variable by destination
- Total: $450-800/container + outbound freight
Traditional Warehouse Costs:
- Long-haul drayage: $800-1,500/container
- Per diem/demurrage: $150-1,500/container (average $450)
- Warehouse receiving: $500-1,000/container
- Monthly storage: $200-500/container
- Warehouse handling: $300-600/container
- Outbound transportation: Variable (typically higher due to location)
- Total: $1,950-5,100/container + outbound freight
Direct cost savings: $1,500-4,300 per container
Break-Even Analysis
At what volume does transloading make sense?
Fixed costs for establishing transloading partnership: ~$5,000-10,000 (contracts, IT integration, process setup)
Break-even calculation:
- Average savings per container: $2,500
- Fixed costs: $7,500
- Break-even volume: 3 containers
Conclusion: If you import more than 3-5 containers monthly, transloading likely delivers positive ROI.
For businesses importing 50+ containers monthly, payback period is typically under 2 months.
Beyond Direct Cost Savings: Strategic Benefits
Improved Customer Satisfaction
Faster delivery = happier customers = better retention and referrals
Quantified impact: 5% improvement in customer retention on $20M revenue = $1M additional revenue
Supply Chain Agility
Ability to respond quickly to demand changes, reroute shipments, or adjust strategies has value that’s hard to quantify but critically important in volatile markets.
Competitive Positioning
Speed-to-market advantage can be the difference between winning and losing in competitive categories.
Example: Fashion retailers using transloading can react to trends 30+ days faster than competitors using traditional warehousing—capturing sales while competitors are still waiting for inventory.
Risk Mitigation
Less inventory sitting in one location = reduced risk from:
- Warehouse damage (fire, flood, theft)
- Obsolescence
- Market shifts
- Port strikes or disruptions
Sustainability
Reduced carbon footprint appeals to:
- Environmentally conscious consumers
- Corporate ESG initiatives
- Regulatory compliance in green markets
- Brand reputation enhancement
Factors That Maximize Transloading ROI
1. Container Volume
Higher volume = better economics
- More containers mean better negotiated rates
- Spread fixed costs across more units
- Greater leverage with service providers
Sweet spot: 30+ containers monthly sees optimal pricing and service
2. Product Characteristics
Best candidates for transloading:
- High-velocity items (turn quickly)
- Time-sensitive goods (seasonal, perishable)
- Products serving multiple destinations from one container
- High-value items (where inventory carrying costs are significant)
Less ideal (but still beneficial):
- Very slow-moving products that need long-term storage anyway
- Extremely fragile items requiring minimal handling
- Products needing significant value-added services
3. Destination Geography
Maximum benefit when:
- Serving West Coast markets from LA/Long Beach ports
- Multiple delivery locations per container (consolidation opportunities)
- Regional distribution within 1,500 miles of port
Still beneficial but different economics:
- Cross-country distribution (consider transload + intermodal rail)
- Single destination per container (less consolidation benefit)
4. Supply Chain Sophistication
Greater ROI for companies with:
- Predictable shipping patterns (easier to plan)
- Good demand forecasting (minimize storage needs)
- Strong supplier relationships (coordinate timing)
- Integrated technology (maximize efficiency)
5. Partner Selection
Choose transloading partners offering:
- Strategic location (within 30 minutes of port)
- Asset-based operations (owned equipment)
- Integrated services (one-stop solution)
- Technology capabilities (visibility and optimization)
- Proven experience (especially in your industry)
Common Objections (And Why They Don’t Hold Up)
Objection 1: “We need long-term storage space”
Reality: Most companies overestimate their storage needs. Transload providers offer short-term storage options when needed, and the majority of inventory can flow through quickly.
Solution: Start by transloading fast-moving inventory (often 60-80% of volume), keep only slow-movers in traditional warehouse.
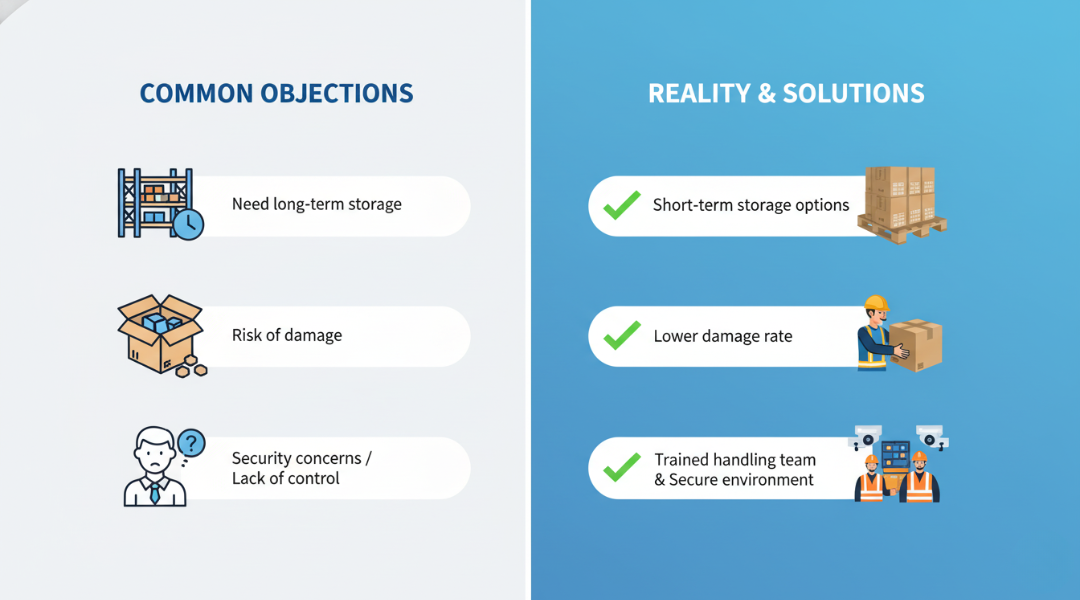
Objection 2: “Transloading means extra handling and damage risk”
Reality: Damage rates at professional transload facilities are typically lower than warehouse operations due to:
- More recent, specialized equipment
- Staff trained specifically for container unloading
- Streamlined processes with fewer touches
- Better security and climate control
Solution: Review provider’s safety record, insurance coverage, and ask for references.
Objection 3: “Our customers aren’t ready to receive immediately”
Reality: Transload facilities offer flexible hold times—your freight doesn’t have to ship out immediately.
Solution: Build in 1-3 days of buffer storage at the transload facility. You still save significantly vs. traditional warehousing while maintaining flexibility.
Objection 4: “Setup is too complicated”
Reality: Professional transload providers manage the complexity for you—they’ve done this hundreds of times.
Solution: Choose a partner who handles coordination with customs brokers, trucking companies, and receivers. Expect a 2-4 week onboarding period for your first containers.
Objection 5: “We don’t import enough volume”
Reality: Even low-volume importers benefit from transloading.
Solution: At 5-10 containers monthly, savings of $2,000-3,000 per container mean $120,000-360,000 annual benefit—worthwhile for almost any business.
Implementation: Getting Started
Phase 1: Data Gathering (Week 1-2)
Collect information about your current costs:
- Per-container drayage costs
- Average per diem charges
- Warehouse fees (receiving, storage, handling)
- Inventory carrying costs
- Average time from port to customer delivery
- Customer feedback on delivery speed
Phase 2: Analysis (Week 2-3)
Calculate your potential ROI:
- Use the cost model provided above
- Factor in your specific product and destination mix
- Consider strategic benefits beyond direct savings
- Identify which portion of volume is best suited for transloading
Phase 3: Partner Selection (Week 3-5)
Evaluate transloading providers:
- Request proposals from 3-5 qualified providers
- Visit facilities in person
- Check references thoroughly
- Review technology capabilities
- Understand pricing structure and terms
Phase 4: Pilot Program (Week 6-10)
Start small to validate assumptions:
- Select 10-20 containers for initial trial
- Establish clear metrics and tracking
- Monitor closely and gather feedback
- Compare actual results to projections
- Make adjustments as needed
Phase 5: Scale Up (Month 3+)
Expand based on pilot learnings:
- Transition more volume to transloading
- Optimize processes based on experience
- Negotiate improved rates at higher volume
- Implement additional value-added services
- Track ROI and continuously improve
Measuring Success: Key Performance Indicators
Track these metrics to quantify transloading ROI:
Cost Metrics
- Cost per container (all-in from port to outbound truck)
- Per diem charges (should approach zero)
- Drayage cost per container
- Outbound transportation cost per shipment
Speed Metrics
- Container dwell time (port arrival to transload facility)
- Transload cycle time (facility arrival to outbound departure)
- Total port-to-customer time
Quality Metrics
- Damage rate (should be <0.5%)
- Shipment accuracy (correct items to correct destinations)
- On-time delivery percentage
Financial Metrics
- Inventory turns (should improve significantly)
- Cost of capital tied up in inventory
- Total logistics cost as % of revenue (should decrease)
- Overall supply chain ROI
Why Precision Worldwide Logistics Delivers Superior ROI
Strategic Advantages
Location: Less than 30 minutes from LA/Long Beach ports—minimizing the largest cost component (drayage)
Assets: Owned trucks and chassis—no dependency on tight equipment markets or broker markups
Experience: 25+ years at LA ports—we know every optimization trick that saves money
Integration: One partner from port to final delivery—simplified vendor management and accountability
Technology: Real-time cost tracking—you see where every dollar goes and can optimize continuously
Proven Results
Our clients typically achieve:
- 30-45% reduction in port-to-destination costs
- 60-80% faster delivery to market
- 90%+ reduction in per diem/demurrage charges
- 25-40% improvement in inventory turns
- 300%+ ROI in first year
Ready to Calculate Your Savings?
Don’t let hidden costs continue eroding your profitability. Transloading near the Port of Los Angeles delivers measurable ROI—typically within the first 30-60 days of implementation.
Get Your Free ROI Analysis
Contact Precision Worldwide Logistics for a customized cost-benefit analysis based on your specific:
- Container volume and freight characteristics
- Current cost structure
- Destination mix
- Service level requirements
Our logistics experts will model your potential savings and develop an implementation roadmap—with zero obligation.
📞 Call: (800) 937-1599
✉️ Email: [email protected]
🌐 Visit: www.precisioninc.com
Stop losing money on inefficient port-to-warehouse logistics. Let’s build your business case for transloading today.
Final Thought: The Cost of Inaction
Every month you wait to implement transloading is another month of:
- Excessive drayage payments
- Accumulated per diem charges
- Wasted warehouse fees
- Slow inventory turns
- Missed sales opportunities
For a business importing 100 containers monthly, the cost of inaction is approximately $200,000-400,000 per month.
The question isn’t whether you can afford to implement transloading—it’s whether you can afford not to.
Precision Worldwide Logistics – Turning Port Logistics into Profit Centers Since 1999