A comprehensive decision framework for logistics managers
The question seems simple: Should you store your inventory or move it through quickly?
But behind this choice lies one of the most consequential decisions affecting your supply chain costs, delivery speed, and competitive positioning. Choose wrong, and you’ll either bleed money on unnecessary storage or create costly stockouts. Choose right, and you’ll outmaneuver competitors while improving your bottom line.
This guide breaks down exactly when cross-docking delivers superior results versus when traditional warehousing remains the better choice—plus how to calculate which approach saves your business more money.
The Fundamental Difference
Before diving into comparisons, let’s establish clear definitions:
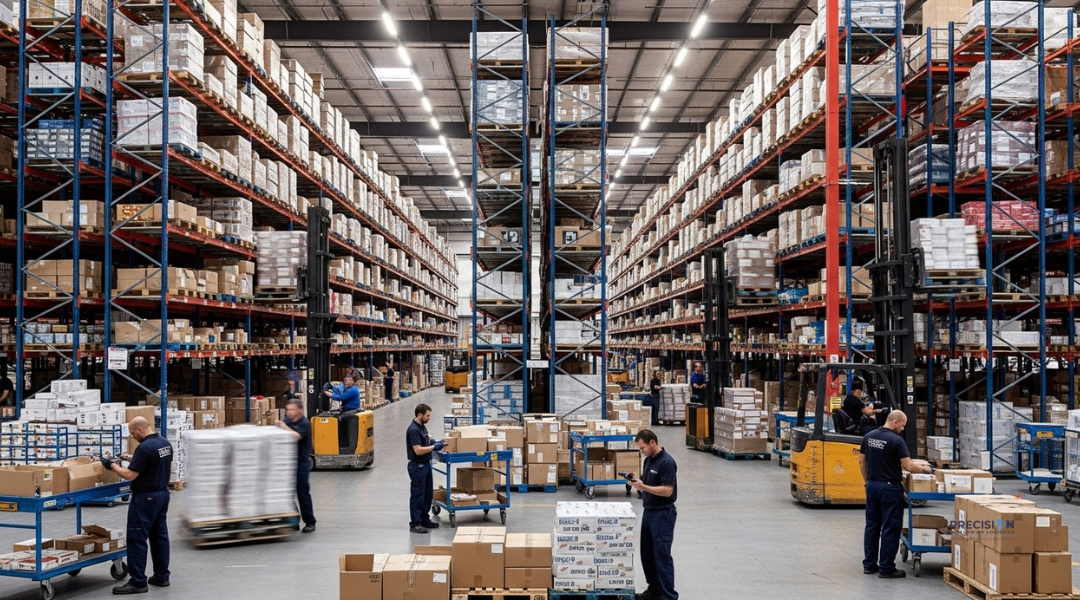
Traditional Warehousing
Goods arrive at a facility and are:
- Received and inspected
- Put away into designated storage locations (racks, shelves, floor space)
- Stored for days, weeks, or months
- Retrieved when customer orders arrive
- Picked, packed, and shipped to final destinations
Primary function: Creating an inventory buffer that allows you to fulfill variable customer demand from stock.
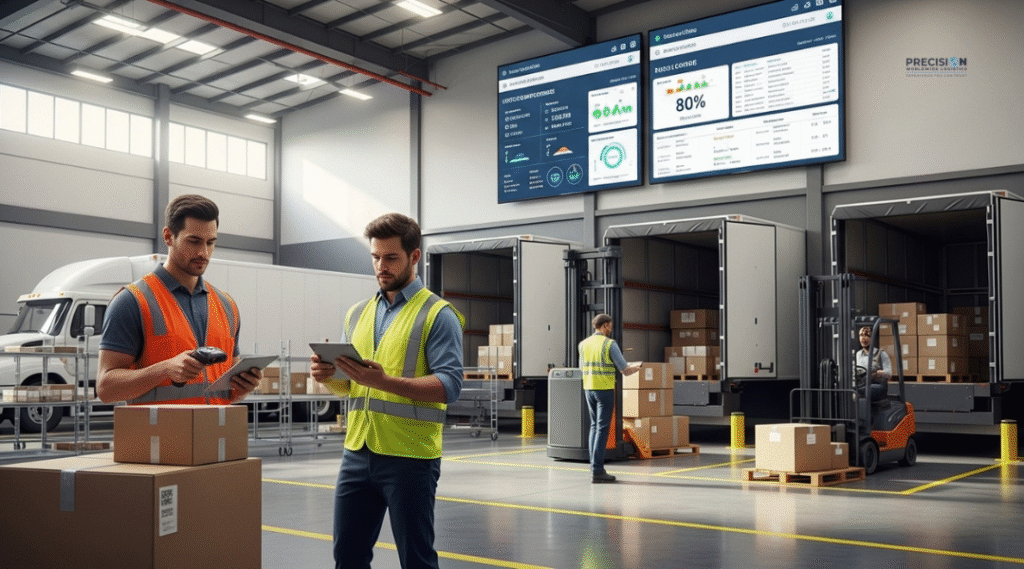
Cross-Docking
Goods arrive at a facility and are:
- Received and immediately sorted
- Transferred directly to outbound trucks
- Shipped to final destinations within hours
- Never placed into storage
Primary function: Accelerating flow of goods through the supply chain to minimize time and cost between supplier and customer.
The True Cost Comparison
Most businesses focus on obvious warehouse rental rates but miss the complete cost picture. Let’s break down every expense category.
Storage & Facility Costs
Traditional Warehousing:
- Warehouse rent: $6-15 per square foot annually (varies by market)
- Utilities (HVAC, lighting): $1-2 per square foot annually
- Property taxes and insurance
- Maintenance and repairs
- Security systems and personnel
- Warehouse management system (WMS) software
- Racking, shelving, and storage equipment
Cross-Docking:
- Minimal facility space needed (flow-through design)
- Lower utility costs (shorter occupancy times)
- Reduced security costs (less inventory on-site)
- Simpler system requirements
- Less storage infrastructure investment
Typical savings from cross-docking: 40-60% on facility-related costs
Labor Costs
Traditional Warehousing requires:
- Receiving staff
- Putaway labor (moving goods to storage)
- Inventory counters
- Order pickers
- Packing staff
- Shipping personnel
- Supervision and management
- Quality control teams
Cross-Docking requires:
- Receiving staff
- Sorters (substantially fewer than pickers)
- Loading personnel
- Light supervision
The difference: Warehousing typically requires 3-5 times more labor hours per unit handled because of multiple touches throughout the process.
Typical labor cost savings from cross-docking: 50-70% reduction
Inventory Carrying Costs
This is where many businesses dramatically underestimate warehousing expenses.
Cost of capital tied up in inventory:
- If your company’s cost of capital is 8-12% annually
- And you carry $5 million in average inventory
- That’s $400,000-600,000 in annual opportunity cost
Cross-docking advantage: Inventory moves through in hours rather than weeks, reducing average inventory on hand by 60-80%.
Additional carrying costs avoided:
- Obsolescence risk (especially for technology, fashion, seasonal goods)
- Shrinkage and theft
- Insurance premiums
- Damage from long-term storage
- Expiration/spoilage (food, pharmaceuticals)
Typical carrying cost savings: 60-75% reduction
Handling & Damage Costs
Traditional warehousing touches per unit:
- Initial receiving scan
- Movement to staging area
- Putaway to storage location
- Storage location scan/verification
- Retrieval from storage
- Movement to picking area
- Order picking
- Movement to packing station
- Packing
- Movement to shipping dock
- Loading onto truck
Average: 8-12 touches per unit
Cross-docking touches per unit:
- Receiving scan
- Sort to outbound lane
- Loading onto truck
Average: 2-4 touches per unit
Impact: Each touch increases damage risk by approximately 0.1-0.3%. With 8-12 touches, traditional warehousing sees 0.8-3.6% damage rates versus 0.2-1.2% for cross-docking.
Cost impact: For $10 million in annual product throughput, reducing damage by 2% saves $200,000.
Transportation Costs
Warehousing often creates transportation inefficiencies:
- Multiple partial truckloads to the same destination (because orders are picked at different times)
- Less-than-truckload (LTL) shipments costing 2-4x more per unit than full truckload (FTL)
- Longer average shipping distances (warehouse may be distant from both suppliers and customers)
Cross-docking enables transportation optimization:
- Consolidation of multiple suppliers’ shipments into full truckloads
- Direct routing from port or supplier to customer without intermediate stops
- Better utilization of transportation assets
Typical transportation savings: 20-35% through improved consolidation and routing
When Cross-Docking Wins: The Perfect Scenarios
Scenario 1: Pre-Sold or Highly Predictable Demand
Example: A retailer knows exactly which stores need which products based on point-of-sale data and replenishment algorithms.
Why cross-docking wins: Since you already know where everything goes, storage adds zero value—it only adds cost and time. Cross-docking gets products to stores 3-5 days faster while eliminating storage expenses.
Financial impact:
- Eliminated: $8/pallet × 30 days × 1,000 pallets/month = $240,000 annually
- Improved: 5-day faster delivery = better in-stock rates = 2-5% sales increase
Scenario 2: Perishable or Time-Sensitive Products
Example: Fresh produce, dairy, flowers, or promotional goods tied to specific events.
Why cross-docking wins: Every day in storage degrades product value. For perishables, it reduces shelf life. For promotional items, delayed delivery means missed sales windows.
Financial impact:
- Fresh produce gaining 5 days of shelf life = 15-25% reduction in spoilage
- On $5M annual produce volume = $750,000-1,250,000 saved
Scenario 3: High-Volume, Fast-Moving SKUs
Example: Staple consumer goods with consistent daily demand—beverages, snacks, personal care items.
Why cross-docking wins: These products turn quickly anyway, so storage infrastructure adds cost without providing inventory buffer value. Moving them faster improves cash flow and reduces capital requirements.
Financial impact:
- Inventory turns: 12/year → 52/year
- Average inventory: $3M → $690K
- Capital freed: $2.31M @ 10% cost = $231,000 annually
Scenario 4: Hub-and-Spoke Distribution Models
Example: Regional distribution center receiving consolidated shipments for redistribution to local routes.
Why cross-docking wins: The hub’s purpose is sorting and routing, not storage. Cross-docking aligns perfectly with this operational model.
Financial impact:
- Facility size: 200,000 sq ft warehouse → 75,000 sq ft cross-dock
- Savings: $1.25M annually on facility costs alone
Scenario 5: Multiple Suppliers to Single Customer
Example: Retailer receiving shipments from 10 different suppliers, all destined for the same distribution center.
Why cross-docking wins: Consolidating these into optimized full truckloads rather than accepting 10 separate deliveries reduces transportation costs dramatically and simplifies receiving at the destination.
Financial impact:
- Transportation: 10 LTL shipments → 2-3 FTL shipments
- Weekly savings: $3,000-5,000
- Annual savings: $156,000-260,000
When Traditional Warehousing Wins: The Right Situations
Scenario 1: Unpredictable or Variable Demand
Example: B2B distributor serving hundreds of small customers with sporadic ordering patterns.
Why warehousing wins: You need inventory available to fulfill orders whenever they come in. Cross-docking requires knowing destinations in advance, which isn’t possible with unpredictable demand.
Value provided: Ability to maintain high customer service levels (95%+ order fill rates) despite demand variability.
Scenario 2: Slow-Moving or Seasonal Products
Example: Industrial equipment parts with intermittent demand, or seasonal goods like holiday decorations.
Why warehousing wins: These products need to be available when customers need them, even if that’s infrequent. Cross-docking doesn’t work when products sit waiting for orders anyway.
Value provided: Product availability without forcing customers to wait weeks for special orders.
Scenario 3: Value-Added Services Requirements
Example: Products needing customization, kitting, assembly, quality inspection, or special packaging before customer delivery.
Why warehousing wins: These activities take time. While you can perform some value-added services during cross-docking, complex operations requiring hours or days need warehousing infrastructure.
Value provided: Customization capabilities that differentiate your offering and command premium pricing.
Scenario 4: Small Order Quantities with Wide SKU Mix
Example: E-commerce fulfillment operation picking 1-5 units across hundreds of SKUs per order.
Why warehousing wins: Cross-docking works for full pallets or cases moving to known destinations. Piece-picking operations need organized storage to efficiently locate and retrieve individual items.
Value provided: Ability to offer broad selection and fast fulfillment of small, mixed orders.
Scenario 5: Geographic Market Buffer
Example: West Coast distribution center stocking products manufactured on the East Coast to serve western customers.
Why warehousing wins: Maintaining regional inventory enables 1-2 day delivery to customers versus 5-7 days from distant manufacturers. The storage cost is offset by improved customer service and competitive positioning.
Value provided: Market responsiveness that drives customer satisfaction and repeat business.
Hybrid Strategies: Getting the Best of Both Worlds
Smart businesses don’t choose one approach universally—they segment their product portfolio and use the optimal strategy for each category.
The 80/20 Approach
Reality: Typically 20% of SKUs generate 80% of volume
Strategy:
- Fast movers (top 20%): Cross-dock for speed and cost efficiency
- Slow movers (bottom 80%): Warehouse for availability
Example: A consumer electronics distributor cross-docks new iPhone models (predictable high volume) while warehousing accessories and older models (variable demand).
Financial impact: Achieve 70% of cross-docking’s cost savings while maintaining full product availability.
Seasonal Transitions
Strategy: Adjust approach based on time of year
Peak season (high volume, predictable): Cross-dock as much as possible Off-season (lower volume, less predictable): Warehouse more products
Example: Apparel retailer cross-docks new spring collections arriving in January-March (all going to stores for season launch) but warehouses remaining inventory in April-August as demand becomes more sporadic.
Geographic Staging
Strategy: Cross-dock at import gateway, warehouse at regional distribution centers
Flow:
- Import containers arrive at Port of LA
- Cross-dock contents to regional shipments
- Regional DCs warehouse inventory for local delivery
Benefit: Speed goods through the expensive port area while maintaining regional inventory buffers closer to customers.
Customer Segmentation
Strategy: Different service levels for different customer types
Large customers (predictable volume): Direct cross-dock delivery Small customers (variable orders): Fulfill from warehouse stock
Example: CPG manufacturer cross-docks to major retailers with predictable replenishment cycles while warehousing inventory for independent stores and distributors.
The Financial Model: Calculate Your Break-Even Point
Use this framework to determine which approach saves more money for your specific situation.
- Step 3: Calculate Savings
- Step 1: Quantify Current Warehousing Costs
- Step 2: Estimate Cross-Docking Costs
- Step 4: Factor in Speed Benefits
- Step 5: Total Financial Impact
📊 Cross-Docking vs Warehousing Cost Calculator
Estimate your annual savings by comparing your current warehousing costs with projected cross-docking costs.
Step 1: Quantify Current Warehousing Costs
Facility Costs
Labor Costs
Carrying Costs
Technology & Equipment
Step 2: Estimate Cross-Docking Costs
These are usually a % of your warehousing costs (auto-filled when Step 1 is complete).
Step 3: Calculate Savings
Net Annual Savings: $0
Cost Reduction: 0%
Step 4: Factor in Speed Benefits
Step 5: Total Financial Impact
Total Annual Benefit: $0
Real-World Example
Company: Mid-size food distributor, $50M annual revenue
Current state (warehousing):
- Facility: $720,000
- Labor: $1,200,000
- Carrying: $450,000
- Technology: $180,000
- Total: $2,550,000
Projected state (cross-docking):
- Facility: $290,000 (40% of warehouse)
- Labor: $480,000 (40% of warehouse)
- Carrying: $90,000 (20% of warehouse)
- Technology: $90,000 (50% of warehouse)
- Coordination: $95,000 (new cost)
- Total: $1,045,000
Cost savings: $1,505,000 annually (59% reduction)
Speed benefits:
- 4 days faster delivery extends shelf life
- Reduced spoilage: $375,000
- Improved cash flow (reduced inventory): $280,000
Total annual benefit: $2,160,000
ROI: 207% in year one
Decision Framework: Your Step-by-Step Guide
Step 1: Analyze Your Product Characteristics
Create a matrix:
| Product Category | Volume | Demand Predictability | Shelf Life | Current Turns | Cross-Dock Fit? |
| Category A | High | Predictable | Long | 12/year | ✓ Strong |
| Category B | Medium | Variable | Short | 8/year | ? Maybe |
| Category C | Low | Unpredictable | Long | 3/year | ✗ Poor |
Cross-docking best for: High volume + Predictable + High turns
Step 2: Evaluate Your Customer Base
Questions to ask:
- Do customers order full pallets/cases or pick pieces?
- Is demand consistent or sporadic?
- Are delivery times pre-scheduled or on-demand?
- Do customers accept direct-from-supplier deliveries?
More “yes” answers = Better cross-dock fit
Step 3: Assess Your Infrastructure
Do you have or can you access:
- Facility with multiple dock doors?
- Robust scheduling and coordination capabilities?
- Technology for real-time tracking?
- Relationships with reliable carriers?
- Staff experienced in time-critical operations?
Gaps here increase implementation costs and risks
Step 4: Calculate Financial Impact
Use the model above to quantify:
- Current warehousing costs
- Projected cross-docking costs
- Net savings
- Value of speed benefits
Positive ROI > 100%? Strong candidate for cross-docking
Step 5: Pilot Test
Don’t convert everything at once:
- Select 10-20% of volume (fast-moving products)
- Run 60-90 day pilot
- Measure actual costs and performance
- Compare to projections
- Adjust and expand if successful
Validation reduces risk and builds confidence
Common Objections (And The Reality)
“Cross-docking is too risky—what if something goes wrong?”
Reality: Professional cross-dock operations have lower error rates than traditional warehousing because:
- Fewer touches = fewer error opportunities
- Faster throughput = less time for problems to compound
- Real-time visibility enables immediate issue resolution
- Experienced providers have refined processes over thousands of operations
Risk mitigation: Start with a pilot, choose an experienced provider, and maintain a small safety stock during transition.
“Our demand isn’t predictable enough”
Reality: Cross-docking doesn’t require perfect prediction—it requires better prediction than you think you have.
Approach: Segment your products. Even businesses with variable demand usually have 20-30% of SKUs with sufficient predictability to benefit from cross-docking. Start there.
“We don’t have the infrastructure”
Reality: You don’t need to build infrastructure—partner with a provider who already has it.
Third-party logistics providers like Precision Worldwide Logistics offer cross-docking services with:
- Established facilities
- Experienced teams
- Proven processes
- Technology systems
- No capital investment required
“Our customers expect immediate availability”
Reality: Cross-docking can actually improve availability for fast-moving items by ensuring continuous flow rather than periodic replenishment.
Strategy: Warehouse slow movers (for availability) and cross-dock fast movers (for efficiency). This hybrid approach serves both needs.
Implementation Roadmap
Phase 1: Assessment (Weeks 1-2)
- Analyze product portfolio
- Calculate current costs
- Identify cross-dock candidates
- Evaluate infrastructure needs
- Calculate projected ROI
Phase 2: Partner Selection (Weeks 3-4)
- Research potential cross-dock providers
- Request proposals
- Visit facilities
- Check references
- Negotiate agreements
Phase 3: Process Design (Weeks 5-6)
- Map out cross-dock flows
- Establish scheduling protocols
- Design coordination procedures
- Integrate technology systems
- Train staff
Phase 4: Pilot Launch (Weeks 7-16)
- Start with 10-20% of volume
- Monitor performance daily
- Address issues immediately
- Collect performance data
- Compare to projections
Phase 5: Evaluation & Expansion (Weeks 17-20)
- Analyze pilot results
- Calculate actual ROI
- Identify improvement opportunities
- Plan expansion to additional products
- Scale operations
Phase 6: Optimization (Ongoing)
- Continuously refine processes
- Expand product coverage
- Optimize consolidation patterns
- Enhance technology integration
- Drive cost improvements
Southern California Advantage
For businesses operating in the Los Angeles market specifically, cross-docking offers unique benefits:
Port Proximity Matters
Challenge: LA/Long Beach ports are the nation’s busiest, creating congestion and costs
Solution: Near-port cross-docking minimizes expensive drayage and gets containers off the port quickly
Savings: $500-1,000 per container on drayage alone
Market Density Creates Opportunities
Advantage: LA serves the western U.S.—the nation’s largest consumer market
Opportunity: High-volume flows enable efficient consolidation cross-docking
Example: One cross-dock facility can efficiently distribute to all of California, Nevada, Arizona, and beyond
Competitive Labor Market
Reality: Southern California warehouse labor is expensive and increasingly scarce
Solution: Cross-docking requires 60% less labor than traditional warehousing
Impact: Reduced exposure to labor market pressures
Partner with Cross-Docking Experts
Understanding when cross-docking delivers superior value is the first step. Actually implementing it successfully requires infrastructure, experience, and execution capabilities.
Precision Worldwide Logistics: Your LA Cross-Docking Solution
Strategic location: Minutes from LA/Long Beach ports and major highways
Proven operations: 25+ years of time-critical Los Angeles logistics experience
Integrated services: Port drayage + cross-docking + delivery under one roof
Technology-enabled: Real-time visibility and coordination systems
Flexible capacity: Handle small pilot programs or full-scale operations
Get Your Free Cross-Dock vs. Warehouse Analysis
Let our logistics experts analyze your specific situation:
- Current cost structure review
- Product portfolio assessment
- Cross-dock suitability evaluation
- Custom financial projections
- Implementation roadmap
Contact Precision Worldwide Logistics:
📞 Call: (800) 937-1599
✉️ Email: [email protected]
🌐 Visit: www.precisioninc.com
Final Thought: It’s Not Either/Or
The smartest logistics strategies don’t force an either/or choice between cross-docking and warehousing. They use both approaches strategically—cross-docking where speed and cost efficiency matter most, warehousing where inventory buffers provide value.
The businesses winning in today’s competitive environment are those that:
- Analyze their product mix objectively
- Calculate true costs accurately
- Segment their approach intelligently
- Execute transitions carefully
- Optimize continuously
The question isn’t whether cross-docking is better than warehousing—it’s whether you’re using the right approach for each product category in your portfolio.
Start with the analysis framework provided above. Calculate your potential savings. Test with a pilot program. Then scale what works.
Every month you delay is another month of unnecessary costs.
Precision Worldwide Logistics – Helping Southern California Businesses Optimize Distribution Since 1999